

4.5%, the Demographics of American Murder and USA Violent Crime Stats
4.5%, the Demographics of American Murder and USA Violent Crime Stats
US Data on Murderers by Race, Sex and Age in the 2020s. From FBI UCR 2021 (NIBRS), CDC WONDER 2022 NVSS (National Vital Statistics System). Updated Mar 15, 2023

It’s impossible to understand the current moment in history without understanding the ongoing spike in violence across America.
And — due to local city politics & broken incentives in documenting crime — the only legitimate national measure of violence is found in Murder data. It’s just not that easy to hide a body.
You’ve surely heard a lot about crime since May 25, 2020. But it can all be summarized with just one number.
This is a comprehensive review on the demographics of murderers and their victims; published here with the goal of educating the public on an underreported topic, and with the hope of improving criminal justice policy in some small way.
4.5%
The number that summarizes the past 2.5 years of post-BLM life in America. But why?
4.5% of Black Males will commit murder in their lifetime as of 2021, if we choose to do nothing about the ongoing epidemic of violence.
6.5% of Black Males (15-74) commit murder over the past 60 years, assuming a 1:1 Murderer:Victim ratio, based on 1,084,990 actual murder victims (1968-2021).
Note: section added March 134.4%—7.2% of yearly Black Male deaths are homicides every year, with no exceptions, since at least 1968. Over 90% of these are Black Male-on-Black Male.
4.35% of Black Males (15-74) were murdered over the past 60 years, based on the 410,000 actual Black Male (15-74) murder victims from 1968-2021.
These are the low-end of what the rates could be in reality, given the large number of “unknowns” in the FBI data and the large number of “indeterminate” violent deaths coded by the CDC.
Whatabout repeat offenders, you ask? The most extreme assumptions can bring the 4.5% down to as low as 3.3%. I ask: does that change our conclusions? Do we continue decarceration on the off-chance that only 3.3% will commit murder?
4.5% of Black Males will commit murder in their lifetime as of 2021
The table below includes the 2021 murder rates of demographic groups split across age, sex, and race as derived from the FBI NIBRS estimation dataset.
Note: a Victim can have multiple Murderers and a Murderer can have multiple Victims. These both are a minority of murder offenses, and are in the same order of magnitude. Because of this, the actual ratio of Victims:Murderers is near 1:1.

The Implied Lifetime Murder Rate for each group is a projection calculated assuming the 2021 rates remain constant for the next 70 years. For Black Males, this is:
Since these are yearly rates per 100,000, we can express them percentages:
4.508% of Black Males are projected to commit a murder in their lifetime
0.059% of White Females are projected to commit a murder in their lifetime
Graphically, the Implied Lifetime Murder Rate looks like the graph below.

At 2021 rates, over 2% of Black Males are projected to commit murder by the time they reach 25 years of age. About 0.27% of White Males are projected to commit murder by age 35.
6.5% of Black Males (15-74) commit murder in the past 60 years
Added March 13 in response to false criticisms.
The 4.5% DOES NOT assume 1 Murderer per 1 Victim — this one section does.
There were 1,084,990 Black and White Americans murdered from 1968-2021.
Black Males (15-74) are responsible for 606,743 of these murders, including the murders of 115,169 women.

At a 1:1 Murderer:Victim ratio — that is, assuming each murderer commits only 1 murder — this would mean 5.9% of Black Males (15-74) commit murder from 1968-2021.
This 5.9% rate over 54 years of actual data is equivalent to a 6.5% murder rate across 60 years.

Suffice to say, this article would have a different title — perhaps “The 6.5%” — had it made the 1:1 Murderer:Victim assumption.
4.4% to 7.2% of yearly Black Male deaths are homicides
Homicides, that is “Murders” plus “Legal Interventions,” were 5.5% of all Black Male deaths in the 54 years from 1968-2021.
Homicides have been as low as 4.4% of yearly Black Male deaths in only 2 years in the record available from CDC WONDER, and as high as 7.2% in 1991.
The overwhelming supermajority (over 90%) of these homicides are Black Male-on-Black Male.

The above graph is the share of deaths, which we expect to be a larger number than the 4.5% “lifetime risk” rate.
This disparity is primarily due to population growth and the relatively young average age of a Black Male homicide victim.
4.35% of Black Males (15-74) were murdered in the past 60 years
Over 410,000 Black Males (15-74) were murdered from 1968 to 2021. These are actual murders, not projections.
This 3.93% risk over 54 years of actual data is equivalent to a 4.351% murder risk across 60 years.
Here, we use the yearly per capita rates and the 15-74 age range to help control for the population effects mentioned in the previous section.
The graph below shows the yearly victimization rates per 100,000 on the Blue line and the cumulative victimization rate on the Orange line.

Take special care to note how much worse things were from the late 1960s through early 1990s. The 2020s are already bad, but they could clearly get even worse.
These are low-end estimates due to indeterminate data
It’s difficult to account for the unknowns and missing data from the FBI set, but the CDC’s coding in WONDER makes it possible to develop some estimates.
The table below shows some undetermined causes of death between 1968-1978 for, respectively by column, “Black Males,” “White Males,” and “Black + White Males.”

These undetermined causes could realistically increase the Black Male rate by an additional 5%.
The graph below of Violent Deaths by Underlying Cause gives a good impression of how many “Undetermined” (in yellow) deaths there are per year in the CDC dataset.
It also shows exactly how consistently small the share is of “Legal Intervention” (grey) homicides.

Taken together, it becomes impossible to deny the fact of the 4.5%. This is not a short-term aberration. These data go back almost an entire lifetime.
What worked?
In short, mass incarceration. At the height of incarceration rates, in 2000, America also saw its lowest rate of violent deaths in recorded history.
Removing criminals from society is the obvious solution, because it obviously works.
But as long as “incarceration” is a 4-letter-word, the violence will continue indefinitely. And on our current trajectory, we could easily end up back in the 1970s.

Gangsta Serial Killers?
The main critique that comes up on this topic is about the unknowable number of repeat murderers. Given known murderers, long-term murder trends, & long-term trends in incarceration rates for murderers, the most extreme assumptions about “Gangsta Serial Killers” could theoretically transform the 4.5% as low as 3.3%.
That’s an unrealistic number, but I’m not sure it even represents any meaningful difference in the conclusions we draw, or in deciding to apply the correct policy of “removing criminals from society.”
Beyond the 4.5%
At the top national level, we can easily see how bad things have gotten in the past decade, especially post-2020 BLM.
For Blacks in America, many states have seen a doubling (100+%) in murder victimization. Oregon’s rate has tripled, and Alaska nearly quadrupled.

While not as bad as for Blacks, Whites have not avoided the almost-universal increase in violence.
With the exception of in the Northeast, Whites have seen an up to 43% increase in their murder victimization rates.

The DEI Crisis in Public Data
DEI is an absolute crisis. Over 1% of the Federal Government workforce are “DEI Officers.”
Public datasets like the ones explored in this article are probably going to be discontinued for “Equity.”
So, call your Senator and demand data equity now.
This is a collection of data & analysis originally published on Twitter, intended in part as an easily accessible reference and a backup. Links to the datasets are available at the bottom of this post. You can find me on Twitter @fentasyl.
To view this (and much more) on Twitter, you can get it at:
DC as a Case Study
The DC metro area makes for a perfect case study that shows the two disparate “BLM effects” quite clearly.
In cities like Baltimore (Baltimore City), the result of the Freddie Gray killing was an almost immediate ~50% increase in murder that has sustained through today. But Baltimore did not see much change post-George Floyd.
DC itself, as well as the suburbs of Baltimore (Baltimore County), saw a ~50% increase post-BLM 2015 and a further ~50% increase post-BLM 2020.
The wealthy suburbs of DC, Montgomery and Prince George’s Counties saw no impact from BLM 2015, but both saw a nearly 100% increase in murder rates post-George Floyd.

Deeper Into the Data
This begins the deep review of the FBI and CDC datasets, primarily focused on 2021. In it, we explore a wide range of specific disparities across race, sex, and age.
Murderers and Victims
It’s important to note that most violence is intra-racial and intra-gender.
Black Male-on-Black Male dominates, with White Male-on-White Male as the runner up.
(Note: FBI NIBRS data makes it difficult to disaggregate “White” from “Hispanic” so consider “White” to mean “White + Hispanic” unless otherwise noted)
Black Males are over 50% of victims and over 55% of known murderers. White Males are over 25% of victims and over 30% of known murderers.

Murderers and Victims by Age & Race
These demographic splits are further variant across age groups.
Young murderers are overwhelmingly Black Males. Older murderers get progressively more White and Female. Victims follow a more non-linear path.

Black Male Victimization
The CDC Victimization data helps us confirm the age relationship in violence, with the clear peak in Black Male Victimization rates seen in the 18-24 year old range.

Interracial Murder
Inter-racial murders show significant disparities.
Over 27% of White murder victims are killed by Blacks, while over 9% of Black murder victims are killed by Whites.

Murder of Women
The racial disparities in the killing of women are stark.
Over 25% of White Females killed are by Blacks, while under 7% of Black Females killed are by Whites.

Hispanic Victim Disparities
Murder Victimization varies greatly by ethnicity, age, and sex.
Young Hispanic Males are much more likely (almost 5x) to be murder victims than Young White Males. There are some disparities between White and Hispanic Females (2x at most), but they’re relatively smaller.

Male Victim Racial Disparities
We can also look at the racial disparities between Male Murder Victimization. Take care to note the substantial age variances, and the attrition with age seen in Black Victimization.
Black Males get murdered at ~14.1x the rate of White Males
Hispanic Males get murdered at ~3.0x the rate of White Males

Sex Differences in Victimization by Race
Digging further into the Racial Sex Differences in Murder Victimization we can see how much more Males are likely to be Murdered than Females:
White Males get murdered at ~2.6x the rate of White Females
Black Males get murdered at ~7.1x the rate of Black Females
Hispanic Males get murdered at ~5.2x the rate of Hispanic Females

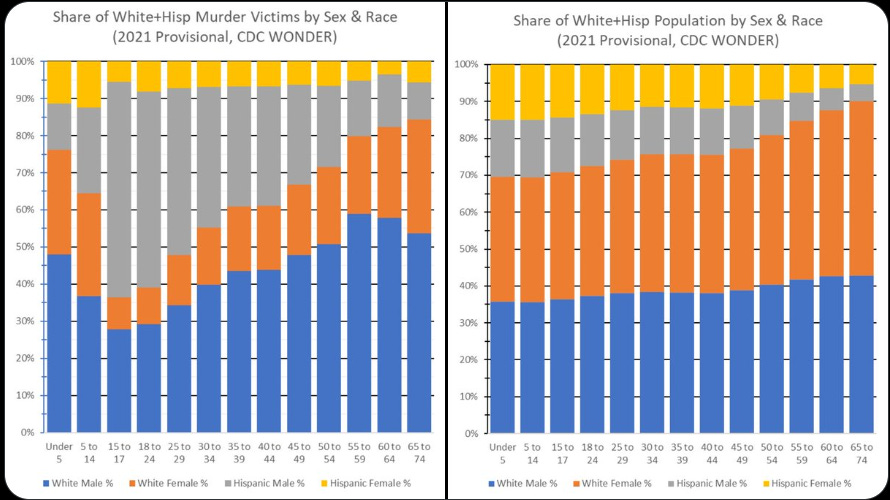
Hispanic Excesses
You may be thinking that the Hispanic/White disparity is due entirely to the relative ages of both groups. While Hispanics are indeed younger on average than Whites, this only explains a small part of their Murder Victimization disparity.
Note how the Murder Victim graph on the left has Hispanic Males (grey) covering a much wider share than their population share on the right.
Temporal Disparities
Murders also show substantial variance across time-of-day. Nearly half of all murders happen at night, between 8pm and 4am.

Female Murderers
We can further see how “Children under 14 years old” is the only category of Murder Victim where Male & Female Murderers are all within the same ballpark.

Age Disparities between Murderer and Victim
Looking at the demographics by Murderer and by Victim: across all demographic groups, the average Murderer is younger than the average Murder Victim.
(From FBI NIBRS)

Compare and contrast that FBI data above with what we see from the CDC below. It’s largely in agreement:

Murderers Per Capita
By combining the FBI Arrest data with US Census population data, we can get an estimate of the rate of committing murder across ages.
For example:
[1 out of every 13900] [White Males over 15 years old] commit murder in 2021
At these rates, we'd expect 1 out of every 220 White Males to commit murder in his lifetime

NIBRS Data Limitations
One limitation in these datasets is in dealing with unsolved murder cases.
Generally, these data can be assumed to underestimate Black Murderers because uncleared cases are disproportionately of Black Victims.
Specifically in NIBRS:
673 White Victims have murderers of unknown race
1913 Black Victims have murderers of unknown race
We can also see how the two sets of demographic data in NIBRS (by arrests and by victims) provide somewhat different numbers for Murderers.
For Males, the differences are minor; for Females, they are somewhat substantial. This is likely because of smaller numbers of Female Murderers, and because NIBRS methodology removes some entries when below a certain threshold for privacy.

Comparing Murderers by Demographic Group
You can also compare these rates against some baseline. This table below includes comparisons against:
"Average American Over 15 years old"
"White Female of the same Age Group"
Within it, we see, for example, [Elderly White Females] commit murder at 0.03x the rate of the [Average American]

Murderers by Race, Combined Sexes
Below is the same table from the lede way up top, but with the sexes combined to show strictly the racial differences in murderers.

Interracial Murder Rates
Taking these calculations a step further, we can project intra- and inter-racial Murder Victimization (take care to note the denominators for each of the rates).
Of all Whites (including Hispanics):
0.258% will be killed
0.187% by Whites
0.071% by Blacks
0.041% will kill a Black
Of all Blacks:
2.281% will be killed
2.057% by Blacks
0.224% by Whites
0.403% will kill a White

Improving Estimates of Hispanic Rates
Synthesizing the FBI NIBRS Interracial Victim & CDC Murder Victimization data helps give us a more complete & accurate picture.
Of White Males:
0.351% will be killed
0.257% by Whites + Hispanics
0.094% by Blacks
Of Hispanic Males:
0.961% will be killed
0.677% by Whites + Hispanics
0.284% by Blacks

Lynching as Historical Context
Here’s one additional comparison to think about, given the focus of politicians on passing the Emmett Till Lynching Act in 2022.
During the worst period of lynching, the 1890s:
1.5 per 100k Blacks died by lynching per year
In the 2020s?
31.6 per 100k Blacks die by murder per year

Single Motherhood?
Interestingly enough, there's no apparent correlation between counties with the highest levels of single Black motherhood and Black Murder Victimization.

Black Victimization by Urbanization
We see 3 regimes in the CDC’s Black Murder Victimization data:
2010-2014: Suburbs (“Large Fringe”) & Rural (“Small Combined”) equally safe, and the Inner City (“Large Central”) most dangerous
2015-2019: Ferguson era: Increased murders disproportionately impacting Rural areas
2020-Now: Floyd era: Massive increase in murders everywhere

White Victimization by Urbanization
We see a fairly similar progression for White Victims, with some notable differences.
Wealthy, Liberal, White Suburbs of big cities have always been the safest places to live, and Rural areas the most dangerous
For some White areas, 2021 has even seen a decrease in Murder Victimization relative to 2020

The Inner Citification of Rural America
We can also see the ongoing Inner Citification of Rural America by comparing rates of Murder Victimization in other locations against the Inner City “Large Central Metro” Murder Victimization rates.
In 2010, the inner city was 2.07x more deadly than rural areas
By 2019, that difference collapsed to 1.28x
We note the Floyd effect disproportionately hit Large/Medium Urban areas, modestly reversing the Rural Citification effect as of 2021.

The Urban-Rural Divide for White Victims
From NIBRS, we can also see that there’s a clear Urban-Rural divide in White Murder Victimization rates.
In Dense Cities, Whites experience high Murder Victimization from both Whites and Blacks. In Rural places, Whites experience high Murder Victimization from Whites. In wealthy Suburbs, Whites are relatively quite safe from murder.

The Urban-Rural Divide for Black Victims
There is some Urban-Rural divide for Blacks, where they experience more Murder in dense cities, but it is much less stark than what we see for Whites.

St. Louis City vs. Suburbs
As a final note, an underappreciated part of CDC WONDER is that it provides 2 different sets of Murder Victimization location data:
County of Residence of Decedent
County of Occurrence where the Decedent died
Using St. Louis as an example, we can see how the inner city interacts with its surrounding suburbs:
196 Black Murders occur in STL city per 100k STL city residents
117 Black residents of STL city per 100k STL city residents are murdered
34 Black Murders occur in STL county per 100k STL county residents
66 Black residents of STL county per 100k STL county residents are murdered

Arrestees
Sampling out a new format with relevant data:

That’s all folks. Thanks for reading.
Follow me on Twitter @fentasyl for more, much more, in-depth data on this topic and others.
Sources
The CDC WONDER 2021 dataset can be found at:
https://wonder.cdc.gov/mcd.html
The FBI NIBRS 2021 Estimation dataset can be found at: https://cde.ucr.cjis.gov/LATEST/webapp/#/pages/downloads
I shared this data in a politics forum and was told that 'the data is racist and cherrypicked'...... but so far, I have seen nothing to overturn your findings. It is NOT racist to post the hard truth. And we should ALL be heartbroken that this is a reality among our black population.
Directly correlates with the destruction of the black family by the democratic party, later republicans piles on. Read Thomas Sowell on intact black family up to the civil right movement and the social welfare system.